Analyzing Slices
You can compute a range of measurements for each slice within an image stack or region of interest and then plot the selected measurements across all slices of the dataset. In addition, multiple panels can be opened to compare results from different views of your data or from multiple datasets.
- Right-click the 2D view containing the data you need to analyze.
Note You can analyze slices in any MPR view, as well as in any oblique view.
- Choose Start Slice Analysis in the pop-up menu.
The Slice Analysis panel appears on the right side of the workspace on the Slice Analysis tab.
Note The Slice Analysis panel is linked to the view from which is was accessed. This linking is indicated with the color-coded bar at the top of the panel. If required, you can open multiple panels to directly compare measurements between different views.
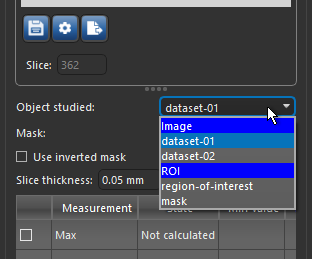
- Select the image or region of interest that you need to analyze in the Object studied drop-down menu, as shown below.
- Choose a mask if you want limit the computed measurements to the volume defined by a region of interest, optional.
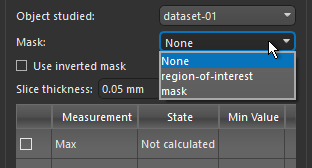
Note Check the Use inverted mask option to compute measurements outside the selected mask.
- Select the measurements that you to include in your analysis.
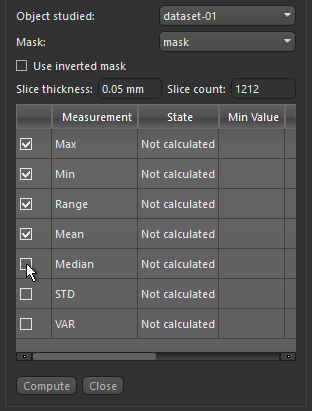
Note Refer to Per Slice Measurements for Images and Per Slice Measurements for ROIs for information about the available measurements for images and regions of interest.
- Click the Compute button.
The value(s) extracted from the current image slice, as well as the corresponding minimum and maximum values that were extracted from the selected object as whole, appear in the measurement table and are plotted in the top section of the panel. You can scroll through the slices by dragging the marker that appears on the plot, as shown below.
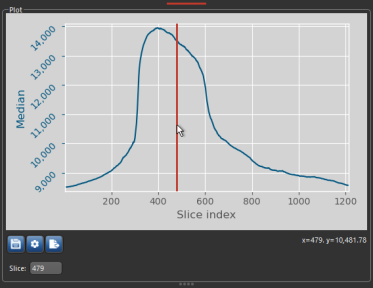
Note Refer to Plot Tools for information about saving an image of the plot, changing the formatting of the plot, as well as exporting the results in the CSV file format.
- Perform additional analyzes on other views of the dataset or start an analysis of another dataset, optional.
Note Each Slice Analysis panel is linked to the view in which it was accessed. This linking is indicated with the color-coded bar at the top of the panel.

